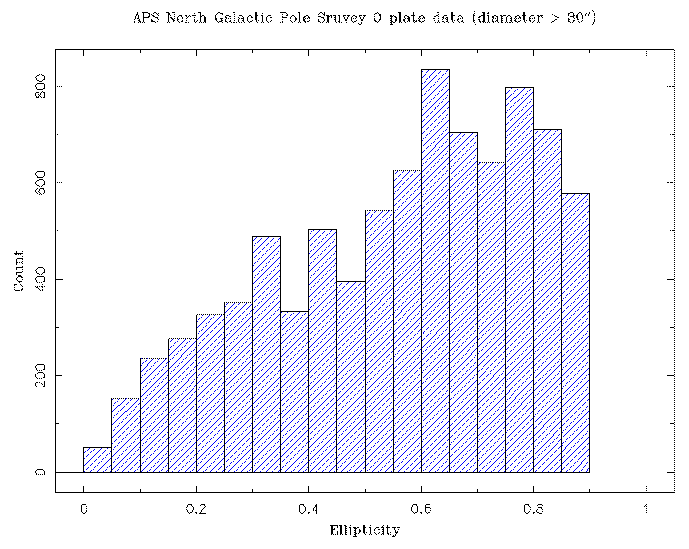
Figure 4: The APS Ellipticity Distribution of a Diameter Limited Sample
The ellipticity distribution of a APS diameter-limited sample of galaxies. Notice that the distribution is peaked at high ellipticities, which is contrary to the UGC (whose ellipticities have a flat distribution). This is a clear indication that the diameters in the two catalogs are different. Evidence in Figure 3 indicates the APS diameters are a closer representation of isophotal diameters than the UGC. (Click on the figure below for the full size version)